If you’re venturing into the world of stock investing, you’ve likely encountered the term “Price-to-Earnings Ratio” or “P/E Ratio.” But what is it and how do you use it to assess a company’s stock? Let’s break down what the P/E ratio means, how to calculate it, and why it matters for your investment decisions.
What is the P/E Ratio?
The Price-to-Earnings Ratio is a valuation metric that compares a company’s stock price to its earnings per share (EPS). In simple terms, it shows how much investors are willing to pay for each dollar of a company’s earnings. This ratio is widely used by investors, analysts, and financial professionals to gauge the relative value of a company’s shares compared to its financial performance.
Calculating the P/E Ratio
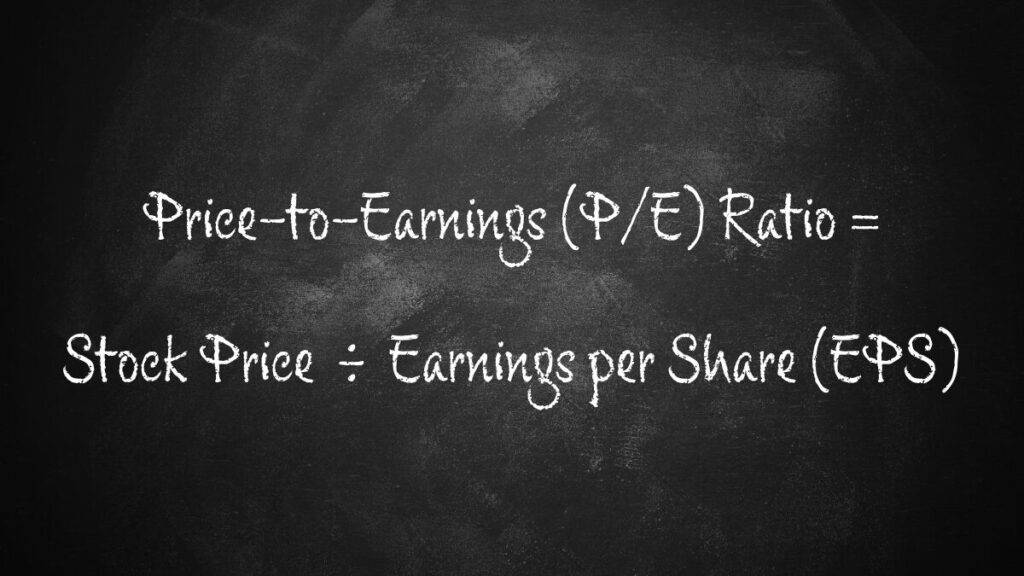
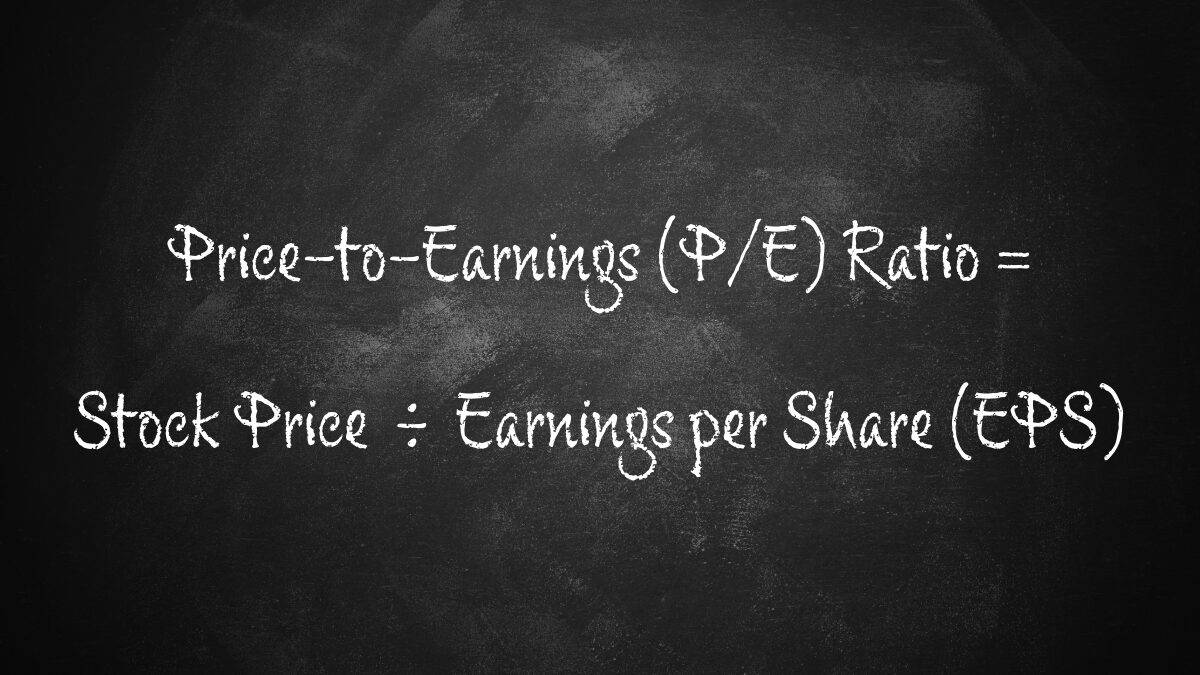
The formula for the P/E Ratio is straightforward:
P/E Ratio = Stock Price ÷ Earnings Per Share
For example, if a company’s stock is trading at $50 and its earnings per share for the past year were $2, the P/E Ratio would be:
P/E Ratio = $50 ÷ $2 = 25
This means investors are willing to pay $25 for every dollar of earnings the company generates. It’s important to note that there are two main types of P/E ratios: trailing P/E, which uses the past 12 months of earnings, and forward P/E, which uses projected future earnings. Each has its merits and limitations, so investors often consider both when evaluating a stock.
Interpreting the P/E Ratio
A higher P/E ratio generally suggests that investors expect higher earnings growth in the future. However, it could also indicate that a stock is overvalued. Conversely, a lower P/E ratio might suggest that a company is undervalued, or it could signal underlying problems with the business.
When interpreting P/E ratios, context is key. A company with a P/E of 30 might seem expensive compared to the overall market, but if it’s a high-growth tech company in an industry where the average P/E is 40, it could actually be considered relatively cheap. Similarly, a P/E of 10 might seem attractive, but if the company is in a declining industry or facing significant challenges, it could still be overvalued.
It’s important to note that there’s no one-size-fits-all “good” P/E ratio. The metric varies significantly across industries and should be compared to:
- The company’s historical P/E ratios
- The P/E ratios of similar companies in the same industry
- The overall market P/E ratio
You can gain a better understanding of how the market values the company relative to its peers and its own history by comparing a company’s P/E ratio to these benchmarks. This can help you identify potential investment opportunities or red flags.
Using the P/E Ratio in Your Investment Strategy
While the P/E ratio is a powerful tool, it shouldn’t be used in isolation. Here are some tips for incorporating it into your investment analysis:
- Consider the industry context: Some industries traditionally have higher P/E ratios due to growth expectations or stability. For example, technology companies often have higher P/E ratios than utility companies because investors expect faster growth from tech firms.
- Look at trends: A company’s P/E ratio changing over time can provide insights into market sentiment and company performance. If a company’s P/E ratio is steadily increasing while its earnings remain flat, it could indicate that the stock is becoming overvalued.
- Use it alongside other metrics: Combine the P/E ratio with other valuation tools like the PEG ratio, dividend yield, or price-to-book ratio for a more comprehensive analysis. Each metric provides a different perspective on a company’s value and financial health.
- Be aware of its limitations: The P/E ratio doesn’t account for debt levels, and it can be skewed by one-time events that affect earnings. It also doesn’t work well for companies with negative earnings.
When using the P/E ratio, it’s important to understand the broader economic and business context. For instance, during periods of low interest rates, P/E ratios tend to be higher across the market because future earnings are discounted at a lower rate. Similarly, during economic downturns, P/E ratios might appear artificially high if earnings have dropped more quickly than stock prices.
Another important consideration is the quality and sustainability of a company’s earnings. A low P/E ratio might look attractive, but if the company’s earnings are volatile or declining, it may not represent a good value. Conversely, a company with a high P/E ratio might be justified if it has a strong competitive advantage and consistent earnings growth.
Broadening Your Investment Knowledge
While the P/E ratio is a vital metric, it’s just one of many tools investors use to evaluate stocks. To make truly informed investment decisions, you should familiarize yourself with a range of financial metrics and analysis techniques. This includes understanding cash flow statements, balance sheets, and income statements, as well as industry-specific metrics that might be relevant to particular sectors.
If you’re looking to deepen your understanding of financial analysis, consider exploring other key formulas and metrics. The Investing Formulas Quick Guide is an excellent resource that covers 12 essential formulas, including the P/E ratio, with clear explanations and practical examples. You’ll be better equipped to analyze potential investments from multiple angles and make more informed decisions by utilizing these formulas.
Conclusion
The Price-to-Earnings ratio is a fundamental tool in any investor’s arsenal. Grasping how to calculate and interpret this metric will better equip you to make smart investment decisions. Don’t forget, while the P/E ratio is valuable, it’s most effective when used as part of a broader analysis strategy.
As you continue to grow your investing skills, keep learning and expanding your knowledge of financial metrics. Pay attention to how successful investors use these tools, and don’t be afraid to dig deep into a company’s financial statements and industry dynamics. With practice and the right resources, you’ll gain confidence in your ability to evaluate potential investments and build a strong portfolio.
Investing is as much an art as it is a science, and the P/E ratio is just one item in your toolkit. You’ll be well on your way to becoming a more successful investor by combining it with other analytical tools, staying informed about market trends, and continuously educating yourself.
Disclaimer: This article reflects the author’s opinion and is not financial advice. The author is not a licensed financial advisor. Content is for informational purposes only. Consult a qualified financial professional before making investment decisions.


